

NWS Wilmington, NC
Weather Forecast Office

|
Water temperature climatology information |
| Latest Water Temp |
| 70° |
Myrtle Beach, located in Horry County, is a part of South Carolina's Grand Strand. From June through early October water temperatures are practically tropical making this area perfect for swimming and beach activities. The water cools significantly during the winter months due to cold offshore winds and longer nights. Water temperatures here tend to be both hotter during the summer and cooler during the winter than at Wrightsville Beach, probably due to shallower water depth atop the broad continental shelf. Other beach communities of Horry and Georgetown counties should have very similar water temperatures including Little River, North Myrtle Beach, Surfside Beach, Murrells Inlet, Litchfield Beach, and Pawleys Island.
Average Water Temperatures for Myrtle Beach, SC
|
January |
February |
March |
April |
May |
June |
||||||||||||
|
1-10 |
11-20 |
21-31 |
1-10 |
11-20 |
21-29 |
1-10 |
11-20 |
21-31 |
1-10 |
11-20 |
21-30 |
1-10 |
11-20 |
21-31 |
1-10 |
11-20 |
21-30 |
|
52 |
50 |
49 |
50 |
50 |
51 |
52 |
55 |
58 |
60 |
63 |
66 |
70 |
72 |
76 |
79 |
81 |
82 |
|
July |
August |
September |
October |
November |
December |
||||||||||||
|
1-10 |
11-20 |
21-31 |
1-10 |
11-20 |
21-31 |
1-10 |
11-20 |
21-30 |
1-10 |
11-20 |
21-31 |
1-10 |
11-20 |
21-30 |
1-10 |
11-20 |
21-31 |
|
82 |
83 |
83 |
83 |
83 |
83 |
83 |
82 |
78 |
76 |
73 |
69 |
65 |
62 |
59 |
57 |
55 |
54 |
Average values are given for early (1st-10th), mid (11th-20th), and late (21st-31st) each month.
Detailed Water Temperature Statistics for Myrtle Beach, SC
Box and Whisker statistical plot. Colored boxes indicate the 25th through 75th percentiles, with the red/blue center of each box indicating the mean (average) value. The black whiskers indicate the highest and lowest temperatures ever observed during each roughly 10 day time period throughout the year.
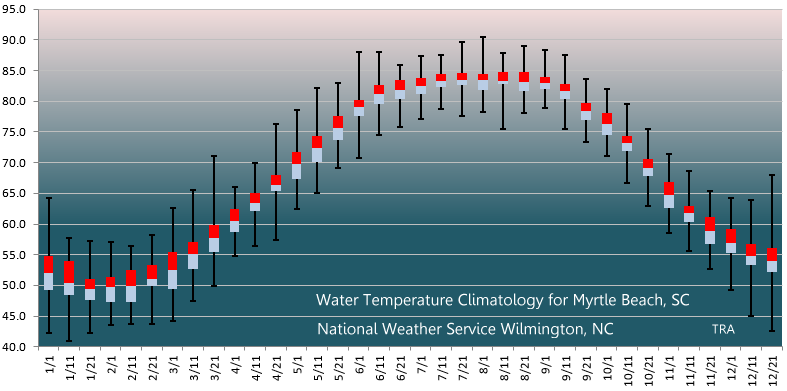
Statistical table of water temperature data. In addition to mean, highest and lowest values for each time period, various percentiles are displayed.
|
|
|
Jan |
|
|
Feb |
|
|
Mar |
|
|
Apr |
|
|
May |
|
|
Jun |
|
|
|
1-10 |
11-20 |
21-31 |
1-10 |
11-20 |
21-29 |
1-10 |
11-20 |
21-31 |
1-10 |
11-20 |
21-30 |
1-10 |
11-20 |
21-31 |
1-10 |
11-20 |
21-30 |
|
Highest |
64.2 |
57.7 |
57.2 |
57.0 |
56.5 |
58.3 |
62.6 |
65.5 |
71.1 |
66.0 |
70.0 |
76.3 |
78.6 |
82.2 |
82.9 |
88.0 |
88.0 |
86.0 |
|
Upper 0.1% |
63.9 |
57.2 |
56.7 |
56.8 |
56.5 |
57.9 |
61.3 |
64.2 |
66.7 |
65.8 |
69.6 |
75.2 |
77.9 |
81.5 |
82.0 |
87.3 |
87.4 |
85.8 |
|
Upper 1% |
63.5 |
56.1 |
55.4 |
56.3 |
56.1 |
57.0 |
59.7 |
61.9 |
64.2 |
65.1 |
68.4 |
72.3 |
76.1 |
79.0 |
80.8 |
86.4 |
86.4 |
85.1 |
|
Upper 5% |
59.0 |
55.8 |
54.7 |
55.6 |
55.4 |
55.9 |
58.8 |
60.3 |
63.0 |
64.6 |
67.1 |
70.5 |
74.5 |
77.2 |
79.2 |
84.6 |
85.5 |
84.6 |
|
Upper 10% |
57.7 |
55.0 |
53.2 |
55.0 |
54.5 |
55.4 |
57.9 |
59.5 |
62.2 |
63.9 |
66.4 |
69.8 |
73.2 |
75.9 |
78.6 |
81.7 |
84.4 |
84.0 |
|
Upper 25% |
54.9 |
54.0 |
51.1 |
51.4 |
52.5 |
53.2 |
55.4 |
57.0 |
59.9 |
62.4 |
65.1 |
68.0 |
71.8 |
74.3 |
77.5 |
80.2 |
82.6 |
83.5 |
|
MEAN |
52.0 |
50.3 |
49.4 |
49.8 |
49.9 |
51.1 |
52.4 |
55.1 |
57.8 |
60.4 |
63.5 |
66.4 |
69.8 |
72.3 |
75.6 |
79.1 |
81.2 |
81.9 |
|
Lower 25% |
49.3 |
48.4 |
47.7 |
47.3 |
47.3 |
49.8 |
49.5 |
52.7 |
55.4 |
58.6 |
62.1 |
65.3 |
67.3 |
70.2 |
73.8 |
77.5 |
79.5 |
80.4 |
|
Lower 10% |
45.0 |
42.8 |
44.8 |
46.4 |
45.9 |
45.3 |
46.9 |
51.1 |
54.1 |
56.8 |
61.0 |
62.4 |
65.5 |
68.4 |
71.8 |
76.5 |
78.6 |
79.2 |
|
Lower 5% |
44.6 |
42.3 |
43.9 |
46.0 |
45.5 |
44.2 |
46.2 |
50.7 |
53.4 |
56.1 |
60.1 |
61.3 |
64.8 |
66.4 |
70.7 |
75.9 |
78.1 |
78.4 |
|
Lower 1% |
43.0 |
41.5 |
43.2 |
45.3 |
45.0 |
44.1 |
44.4 |
48.6 |
52.5 |
55.4 |
57.0 |
60.0 |
63.9 |
65.3 |
70.0 |
74.7 |
77.4 |
77.9 |
|
Lower 0.1% |
42.3 |
41.0 |
42.4 |
44.6 |
43.9 |
43.7 |
44.2 |
47.5 |
52.0 |
55.2 |
56.5 |
58.4 |
63.0 |
65.1 |
69.4 |
71.2 |
75.4 |
77.2 |
|
Lowest |
42.3 |
41.0 |
42.3 |
43.5 |
43.7 |
43.7 |
44.2 |
47.5 |
49.8 |
54.9 |
56.5 |
57.4 |
62.4 |
65.1 |
69.1 |
70.7 |
74.5 |
75.7 |
|
|
|
Jul |
|
|
Aug |
|
|
Sep |
|
|
Oct |
|
|
Nov |
|
|
Dec |
|
ANNUAL |
|
|
1-10 |
11-20 |
21-31 |
1-10 |
11-20 |
21-31 |
1-10 |
11-20 |
21-30 |
1-10 |
11-20 |
21-31 |
1-10 |
11-20 |
21-30 |
1-10 |
11-20 |
21-31 |
|
|
Highest |
87.4 |
87.6 |
89.6 |
90.5 |
87.8 |
89.1 |
88.3 |
87.6 |
83.7 |
82.0 |
79.5 |
75.6 |
71.4 |
68.7 |
65.3 |
64.2 |
63.9 |
68.0 |
90.5 |
|
Upper 0.1% |
86.4 |
87.3 |
89.1 |
90.1 |
87.8 |
88.3 |
88.2 |
87.4 |
83.5 |
82.0 |
79.2 |
74.1 |
70.7 |
68.5 |
65.3 |
64.0 |
63.9 |
67.8 |
88.5 |
|
Upper 1% |
85.8 |
86.9 |
88.0 |
89.2 |
87.6 |
86.9 |
87.4 |
86.9 |
82.9 |
81.3 |
77.5 |
73.0 |
70.3 |
68.2 |
64.8 |
63.5 |
63.1 |
65.5 |
86.4 |
|
Upper 5% |
85.3 |
86.2 |
86.7 |
87.6 |
86.9 |
86.0 |
86.0 |
86.2 |
82.0 |
79.9 |
77.2 |
72.1 |
70.0 |
66.6 |
63.1 |
61.3 |
61.7 |
61.3 |
84.6 |
|
Upper 10% |
84.7 |
85.6 |
85.6 |
86.0 |
86.0 |
85.5 |
85.1 |
84.4 |
81.5 |
79.2 |
76.5 |
71.4 |
69.4 |
65.7 |
62.2 |
60.3 |
59.0 |
59.4 |
83.5 |
|
Upper 25% |
83.8 |
84.4 |
84.6 |
84.4 |
84.7 |
84.7 |
84.0 |
82.8 |
79.7 |
78.1 |
74.3 |
70.5 |
66.9 |
63.0 |
61.2 |
59.2 |
56.7 |
56.1 |
80.2 |
|
MEAN |
82.4 |
83.4 |
83.4 |
83.4 |
83.3 |
83.1 |
83.0 |
81.6 |
78.4 |
76.3 |
73.2 |
69.1 |
64.8 |
61.8 |
58.9 |
57.0 |
54.9 |
53.9 |
67.2 |
|
Lower 25% |
81.1 |
82.4 |
82.6 |
81.9 |
82.8 |
81.7 |
82.0 |
80.4 |
77.0 |
74.5 |
72.0 |
67.8 |
62.6 |
60.3 |
56.7 |
55.2 |
53.2 |
52.2 |
55.4 |
|
Lower 10% |
79.9 |
81.7 |
81.0 |
81.0 |
79.2 |
80.2 |
80.8 |
78.6 |
75.2 |
73.2 |
71.1 |
65.8 |
61.5 |
58.8 |
55.2 |
53.8 |
50.5 |
45.9 |
50.2 |
|
Lower 5% |
79.5 |
80.6 |
79.9 |
80.6 |
76.8 |
79.3 |
80.2 |
77.7 |
74.8 |
72.7 |
70.3 |
64.9 |
60.4 |
57.7 |
54.9 |
52.7 |
46.6 |
45.0 |
47.5 |
|
Lower 1% |
78.3 |
79.3 |
77.7 |
79.3 |
75.9 |
78.4 |
79.7 |
77.0 |
73.9 |
72.0 |
68.2 |
64.0 |
59.0 |
57.0 |
54.1 |
50.5 |
45.5 |
43.3 |
44.2 |
|
Lower 0.1% |
77.2 |
78.8 |
77.5 |
78.4 |
75.7 |
78.3 |
79.3 |
75.9 |
73.6 |
71.8 |
66.9 |
63.5 |
58.6 |
55.9 |
53.4 |
49.5 |
45.1 |
43.0 |
42.1 |
|
Lowest |
77.2 |
78.8 |
77.5 |
78.3 |
75.6 |
78.1 |
79.0 |
75.6 |
73.4 |
71.1 |
66.7 |
63.0 |
58.5 |
55.6 |
52.7 |
49.3 |
45.0 |
42.6 |
41.0 |
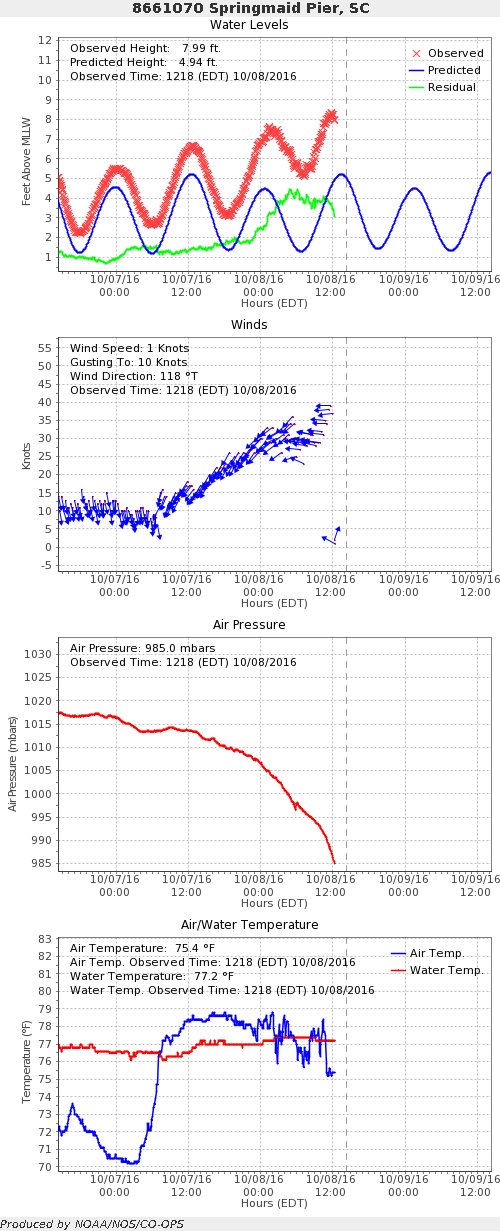
After quality control, a total of 734,148 individual water temperature observations were available to calculate the values used in this climatology. Data was collected from the NOAA/NOS weather and tide station on Springmaid Pier over the period 2005 through 2016. Springmaid Pier and the weather station were destroyed by Hurricane Matthew on October 8, 2016. Historic weather and tide data for this site is available here.
|
Final weather and tide data from Springmaid Pier in Myrtle Beach, SC as Hurricane Matthew struck. Large crashing waves destroyed the pier and the weather station. |
Page Author and Statistical Analysis: Tim Armstrong
Page Created: July 31, 2014
Last Updated: February 28, 2019
 Follow us on X
 Follow us on Facebook
 Follow us on YouTube
 ILM RSS Feed
Forecasts
Local Forecasts
Marine
Tropical
Graphical
Aviation
Rain and Rivers
Fire Weather
Discussion
Beach, Rip Current and Surf
Rip Current Risk
Surf Forecast
Coastal Flood
Weather Activity Planner
Forecast Graph/Tab/Text
Model Guidance
Hazards
Mobile Weather
Briefing Page
Local Hazards
Hazardous Weather Outlook
Latest Briefing
Social Media Feeds
EM Briefing
NOAA Weather Radio
Submit Storm Report
Current Conditions
Marine Obs (List)
Observations Map
Satellite
Marine Obs (Map)
Local Observations (List)
Regional Temps and Precipitation
Daily Temp and Precip Summary
Radar
NWS Wilmington Radar
Southeast Regional Radar
Enhanced National Radar
National Radar
Past Weather and Hydrology
Local Climate Records
Climate Plots
Local Hydro Information
Rainfall and Rivers
Past Significant Events
Weather History Calendar
Additional Information
Weather Safety
Office Newsletter
NWS Product Guide
Mobile Weather
Office History Timeline
About Us
FAQs
Office Programs
NOAA Weather Radio
Skywarn
CoCoRaHS
Storm Ready
Science and Technology
Education and Outreach

US Dept of Commerce
National Oceanic and Atmospheric Administration
National Weather Service
NWS Wilmington, NC
2015 Gardner Drive
Wilmington, NC 28405
(910) 762-4289
Comments? Questions? Please Contact Us.
 Coastal Flood